Many SaaS companies go through a quick growth period, followed by a sudden turn in fortunes that they never manage to overcome.
The scenario often goes like this:
After you launch your product or feature, you see a sudden sharp spike in acquisition—maybe you hit the front page of Product Hunt or someone from TechCrunch discovered your product, fell in love with it, and decided to write about it. You get optimistic—you're seeing a high volume of sign-ups every day. It feels like you've hit the magic formula for growth.
But then things quickly turn around.
Signups taper off, and you begin to realize that the people who signed up in the past don't stick around.
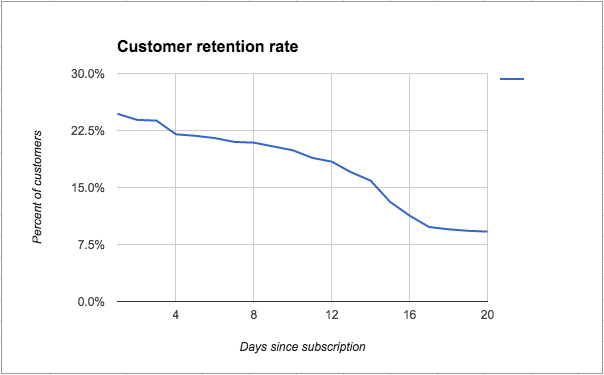
Аs you acquire more users, the pool of available new users shrinks and acquisition gets harder and harder. Soon growth starts slowing, and suddenly it takes a nosedive.
Plotted on a graph, it looks a lot like a shark fin.

The reason so many companies end up with that shark fin curve is that they aren't looking at the numbers that really matter. Signups on their own can be a vanity metric—that number gives you a good feeling, but it doesn't necessarily signify success in generating loyal customers.
In order to grow, teams have to acquire and engage people who will actually use the product and stick around.
If you're running a software product, you have to think carefully about how you define engagement. What sets an “engaged” user apart from the rest?
What is your user engagement rate?
Measuring your engagement rate—and optimizing for it—will help you build a company that's set up for long-term success. But how do you define engagement in measurable terms?
At its most basic, engagement rate is the percentage of users in a particular cohort who remain active over a defined period of time. This information can warn you of potential dangers long before you reach the downward slope of the shark fin.
Here's the simple formula for engagement rate:

Measuring engagement rate essentially comes down to tracking the number of users who are active in your app over a certain period—usually a day, a week, or a month—as a proportion of everyone who signed up during that same period.
How to identify active users
The main challenge here is figuring how you define an active user. “Active user” could mean something as simple as a customer logging in, but does that really represent a person who has strong motivation to use your product?
That's why we prefer Lincoln Murphy's definition of engagement:
Engagement is when your customer is realizing value.
Therefore, the engagement of your product is closely related to your activation events—which are experienced as critical aha moments by your users. Identifying and isolating these moments of value discovery usually involves working backward with a combination of user journey mapping, user interviews, and behavioral analytics to discover the in-product actions that correlate to long-term success and retention.
3 ways to measure user and customer engagement
From here, there are many different ways to measure engagement rate, including:
- Engagement by month, week, or day: This gives you an overview of whether your product is succeeding in creating loyal users over time.
- Engagement by channel: This informs how productive each method of acquisition is and helps you focus on the channels that yield the best customers for your product.
- Engagement by feature: This helps you understand what your users value and guides your product development efforts.
You don’t have to choose just one—you can look at engagement from multiple angles for an even fuller picture of your product. A better understanding of your engagement rates can ultimately help you retain more users and build a strong customer base that supports long-term growth.
Let’s take a look at the 3 approaches in more depth:
1. Calculate engagement rate by month, week, and day
The most popular way to calculate engagement is through straightforward frequencies—DAU, WAU, or MAU:
- Daily active users (DAU): Tracks the total number of users who use your product on a daily basis. It is a useful metric for consumer products with a high volume of activity where users log in every day, like Instagram or TikTok.
- Weekly active users (WAU): Seems to be the preferred method of most SaaS products to track engagement because it removes much of the variability that's typical in DAU, such as weekend dips. Most B2B tools are simply not used every day, so WAU is a much more relevant way to track engagement.
- Monthly Active users (MAU): A good option for tools that are used only a few times each month. Additionally, MAU can be used in tandem with DAU or MAU to track the long-term retention of cohorts of users.
None of these methods is inherently better than the other—the right choice for your product depends entirely on how people can reasonably be expected to use your app.
Active users are usually looked at as a nominal number—the total amount of people who use a product in a given time frame. However, the metric can also be denoted as a percentage and used to analyze how many users in a cohort remain active over time (e.g. customer retention rate or user retention rate).
2. Analyze engagement rate by channel
Looking at the engagement levels of customers over time helps you track your performance, but doesn't necessarily explain what makes some users a better fit than others. That's why it's also important to understand how the channels through which you acquire users affect engagement and retention.
Let's say you acquire users through the following channels:
- Referrals: New customers sign up after being invited by an existing user of your product.
- Direct conversions: People convert on your website after finding it organically or from a link in a guest blog post, ProductHunt, etc.
- Lead nurturing campaigns: You nurture and educate leads with drip email sequences, white papers, and other resources.
Group the users from each of these channels into dedicated cohorts, and analyze the engagement rate of each on a weekly or monthly basis to discover which channel produces the most long-term users. For example, if you find that referrals are a source of high-quality users, you can confidently focus your resources on referral marketing at the expense of other, less productive channels.
📖 Read more: A beginner’s guide to cohort analysis
3. Measure engagement rate by feature
Measuring your app's engagement rate across time periods and channels gives you a high-level overview of how your product is doing. But you also need a magnifying glass that helps you understand why users love your product—that's when the engagement rate of each feature comes to play.
Looking at how each feature of your product affects engagement can also guide your product development efforts, helping you build more of the features that your target audience needs. Feature analysis will make sure you take the right product initiatives and understand what improvements will drive higher usage over time.
To measure engagement rate by feature:
- Start with a handful of product features that you think are most important (or the 2 to 3 of the most recent features you built).
- Calculate engagement rate as the percentage of monthly—or daily, or weekly—active users that use that feature.
- Compare that number to the overall engagement rate of your product.
Here's what this analysis could look like in a music-streaming app. In this case, we're comparing long-term engagement to the retention rate of users who A) use the in-app functionality to share music with their friend and B) those who don't:

In this example we can clearly see that sharing music leads to significantly higher engagement and retention rates. However, that won't be the case for every feature in your product.
Don't be afraid to drop your assumptions when you discover that a feature that you thought was critical hardly gets used. Measuring feature-specific engagement rates is a great tool that can guide your product development efforts.
Stay out of shark-infested waters
Retention is the true marker of success, and user engagement is the lever that drives customer loyalty over time.
When measured correctly, your engagement rate can give you great insights into your user behavior and tell you things like which customers are the best fit for your app and what features you need to build to solve their pains even more effectively.
The fact is, you can’t build a successful software company without getting users to stick around in the long run. So you first need to understand what engages them and why, and then start improving in that direction.
📖 Read more: 6 proven strategies to improve user engagement and fuel growth